
Reputic Dashboard Overview
Your Reputic dashboard is the review management home base for every connected source. It shows total reviews, average score, sentiment, and AI insights in one place, so you can see what customers are saying and choose what to fix first.
Quick answer: The Reputic dashboard gives you one view of your online reviews, scores, sentiment, and AI insights across connected platforms. Use it to spot rating changes, find recurring complaints, and decide where your team should respond or improve next.
New to Reputic? Start your 14-day free trial and connect a review source in about 2 minutes. No credit card required.
Prerequisites
- Active Reputic account
- At least one connected review source
- Reviews synced to your account
What can you see in the Reputic dashboard?
After logging in, you'll land on your dashboard. Here's what you'll see:
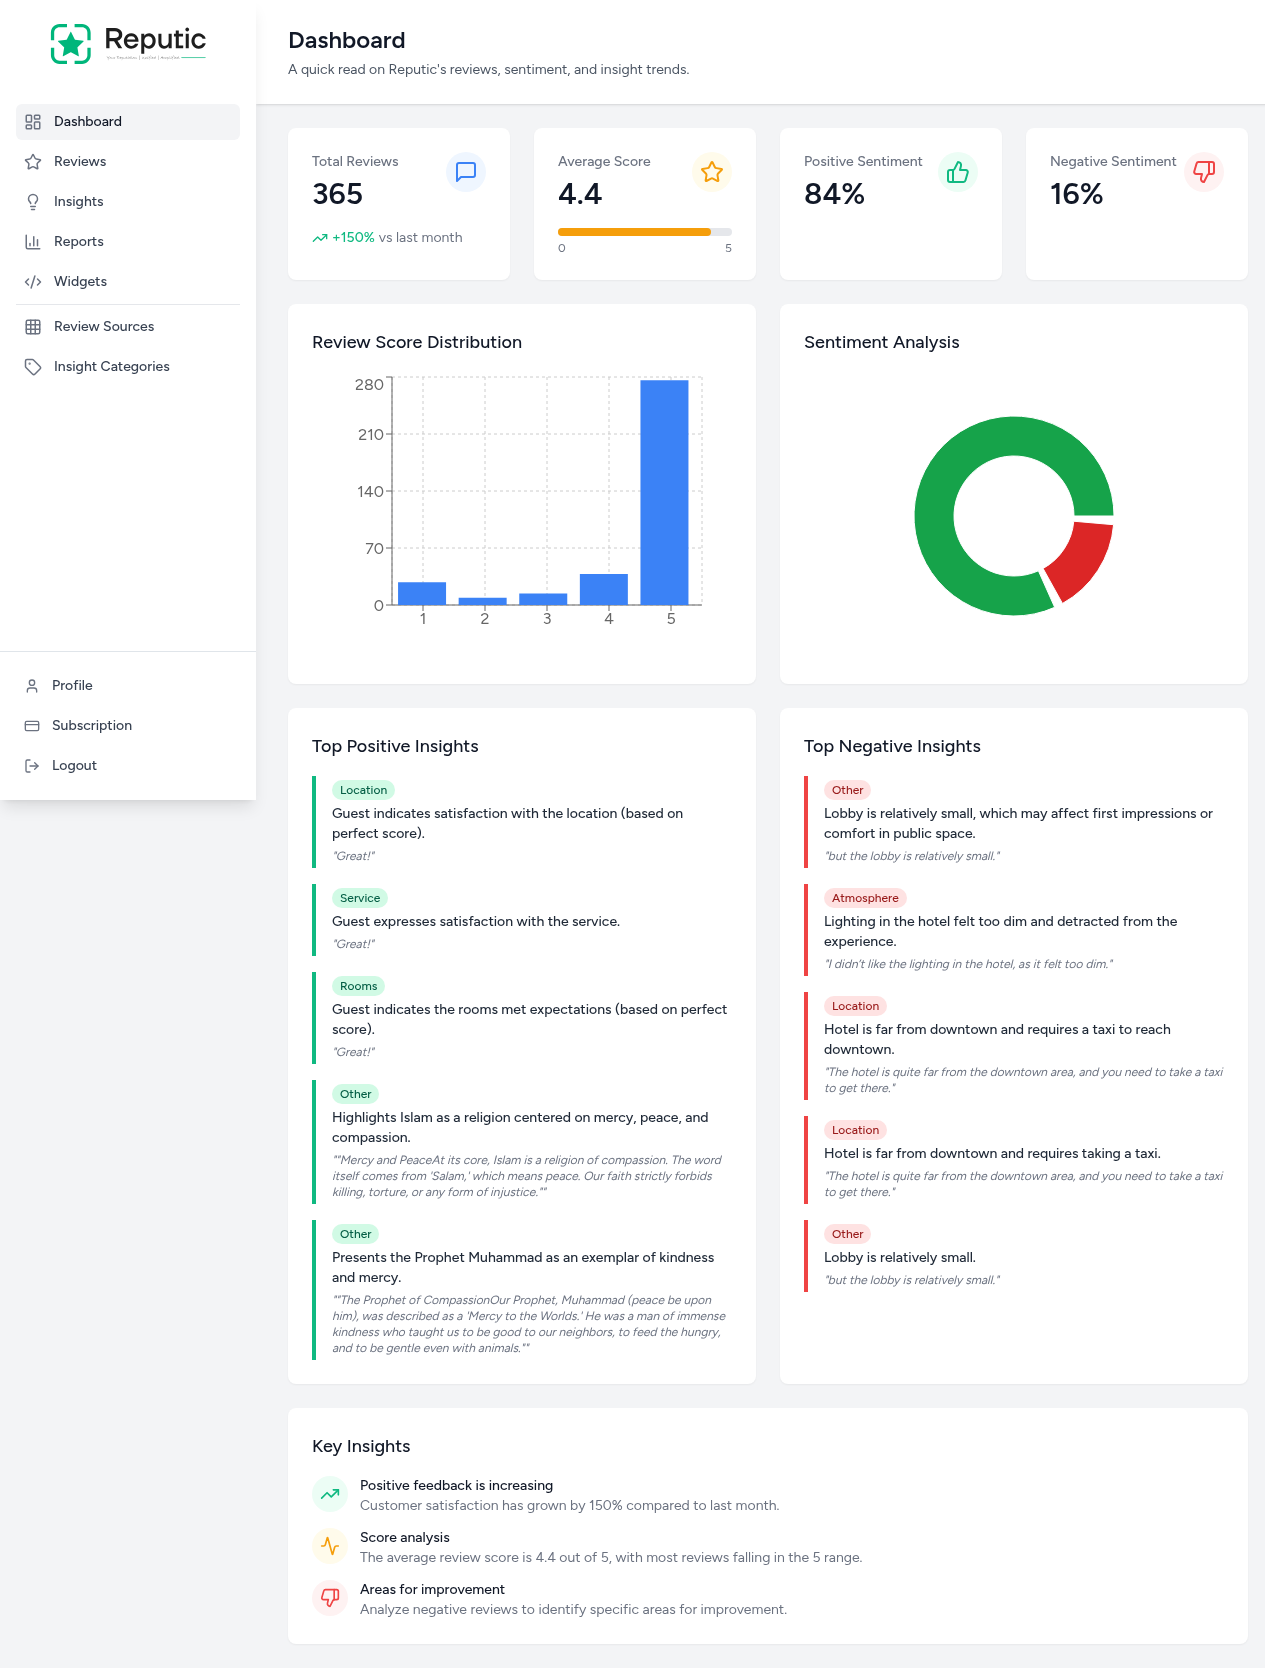
The dashboard groups review activity into a few sections you can scan quickly before you open the full review list.
Which review management metrics matter first?
Start with the four cards at the top of your dashboard:

Total Reviews
Shows the total number of reviews across all connected platforms. The percentage indicator shows growth compared to the previous month. A sudden increase is a good reason to check recent feedback before small issues become patterns.
Average Score
Displays your overall rating on a scale of 0-5. A visual indicator shows where you fall on the scale.
Positive Sentiment
The percentage of reviews with positive sentiment, determined by Reputic's AI analysis.
Negative Sentiment
The percentage of reviews with negative sentiment. Use this to identify potential issues that need attention.
How does the dashboard help with rating trends?
The review score distribution chart shows how your reviews are spread across star ratings from 1 to 5. Use it to check whether low ratings are isolated or becoming common enough to affect your overall score.
How does sentiment analysis work in the dashboard?
The pie chart splits your reviews into positive and negative sentiment. Pair it with the sentiment analysis feature when you want to understand which topics customers praise or complain about most often.
What do top insights tell you?
The dashboard highlights the review themes that deserve attention first:
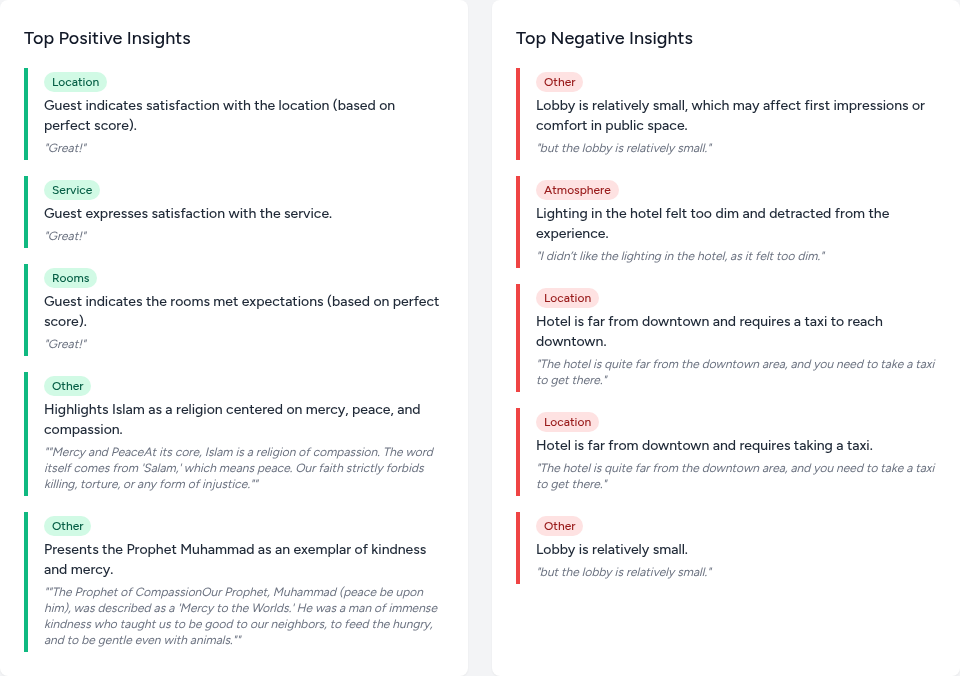
Top Positive Insights
These show what customers love about your business. Each insight includes:
- Category: the aspect being praised, such as location, service, or rooms
- Description: a summary of the positive feedback
- Quote: an actual excerpt from customer reviews
Top Negative Insights
These highlight areas that need improvement. Use them to spot patterns in customer complaints and prioritize fixes.
How should you use dashboard insights?
At the bottom, Reputic summarizes patterns it sees in your reviews:
- Positive feedback trends: how customer satisfaction is changing
- Score analysis: context about your average rating
- Areas for improvement: recommendations based on negative reviews
Turn those patterns into action. Open Managing Your Reviews when you are ready to filter reviews, read the original feedback, and respond from one place. If feedback is spread across too many sources, review Review Aggregation to see how Reputic brings those sources together.
Tips
Check your dashboard weekly to spot trends early. A sudden increase in negative sentiment may point to a service, delivery, or support issue that needs attention.
Use the insights to prioritize improvements. Focus on categories that appear often in negative reviews before you spend time on one-off complaints.
Need help? Contact Support or start a free Reputic trial. No credit card required.
Related Articles
Connecting Review Sources
Learn how to connect your review platforms to Reputic and start aggregating customer feedback from Google, TripAdvisor, Booking.com, and more.
Navigating Your Reviews
Learn how to browse, filter, and read customer reviews from all your connected platforms in one place.
Managing Insight Categories
Learn how to organize and customize insight categories to better understand what matters most to your customers.